Mono Log Profiler
Mono Log Profiler
The Mono log profiler can be used to collect a lot of information about a program running in the Mono runtime. This data can be used (both while the process is running and later) to do analyses of the program behaviour, determine resource usage, performance issues or even look for particular execution patterns.
The events collected include (among others):
- method enter and leave
- object allocation
- garbage collection
- JIT compilation
- metadata loading
- lock contention
- exceptions
How to use the Mono log profiler on Meadow
Profiling on Meadow is pretty simple, you just need to follow a few steps:
Step 1: Enable the Profiler on your Meadow config file
To configure the Mono profiler and specify the data to collect, add the profiler control option to your meadow.config.yaml file. Due to the potential for high data volume and memory consumption, especially on resource-constrained devices, consider the following examples to minimize performance overhead and memory usage:
Example 1: Logging method calls with a call depth of 10, excluding allocation information
MonoControl:
  Options: --profile=log:noalloc,calls,calldepth=10
Example 2: Logging heap shots every 10 seconds:
MonoControl:
  Options: --profile=log:heapshot=10000ms,noalloc,nocalls
Example 3: Logging method calls, excluding allocation information
MonoControl:
  Options: --profile=log:noalloc
Important: Some options consume a lot of memory and should be avoided, due to the limited memory of the embedded device, such as
alloc. The Mono documentation also provides more detailed tips about how to collect less data.
Step 2: Reserve the UART1 (COM1) pins in your Meadow config file.
Assuming that you are using the COM1 on the Project Lab v3.e or in the F7 Feather V2, you should add the following in your meadow.config.yaml to reserve the pins B15 and B14:
Device:
    ReservedPins: B15;B14 # MCU pin names
It's important to notice that the
ReservedPinsfield requires the MCU pin names, which are not the ones you see on the board. If you are using another device, please consult the pinout definition in its datasheet to use the corresponding MCU pin names.
Step 3: Getting the profiling data from the serial port
After connecting a USB serial converter to your Meadow device UART1 (COM1), run the meadow uart profiler enable CLI command, which will read the data from UART1 (COM1) and save it as an output.mlpd file in your computer, e.g.:
meadow uart profiler enable -i /dev/tty.usbserial-1120 -o ./
To learn more about this command you can run:
meadow uart profiler enable --help
That should show more details about this CLI command:
USAGE
  meadow uart profiler enable --interface <value> [options]

DESCRIPTION
  Enables profiling data output to UART

OPTIONS
* -i|--interface    Set the serial interface to read the profiling data via COM1
  -o|--outputDirectory  Set the profiling data output directory path
Step 4: Generating reports for a .mlpd file
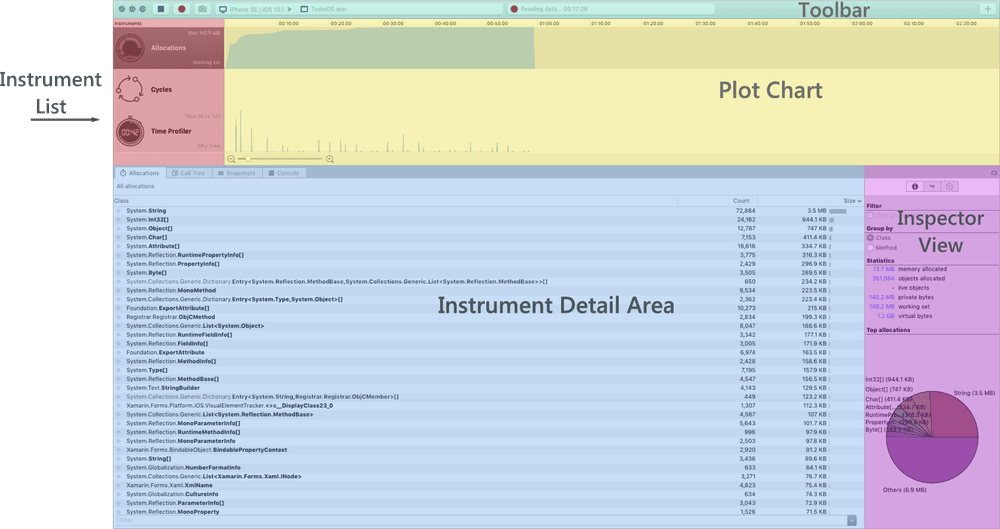
Given the .mlpd obtained in the last step, you can use a report generator, such as the mprof-report (CLI) or the Xamarin Profiler (GUI) to generate a report:

Troubleshooting
If you experience slowdowns in your application or memory errors, try reducing the amount of data collected.
It's important to notice that when no profiler option is specified as below:
MonoControl:
    Options: --profile=log
It is equivalent to using the following:
MonoControl:
    Options: --profile=log:calls,alloc,maxframes=8,calldepth=100
It will collect a lot of data, potentially causing memory errors due to the limited embedded RAM.
To know more about the profiler's options, consult the Mono log profiler documentation, but here are some examples explained briefly of how to collect less data:
- Example 1: Heap shot data can also be huge, but to reduce the frequency, you can specify a heap shot mode: for example to collect every 10 seconds passed since the last heap shot:
MonoControl:
    Options: --profile=log:heapshot=10000ms,noalloc,nocalls
- Example 2: Method enter/leave events can be excluded completely with the
nocallsoption or they can be limited to just a few levels of calls with thecalldepthoption. For example, the option:
MonoControl:
    Options: --profile=calls,noalloc,calldepth=10